Project description: My M.S. research project focused on evaluating methods of detecting forest insect damage and mortality using Unmanned Aerial Systems (UAS)-derived data products in conifer forests of the western United States. The project explored the utlity of point cloud data derived from Structure for Motion (SfM) for the classification and characterization of vertical tree damage of a UAS mission area. I used tools such as ArcGIS Pro, Agisoft Metashape, CloudCompare, and R and Python programming to create new algorithms and establish a novel methodology.
Drone data used for this MS thesis was collected for a broader project assessing tree damage funded by the NASA Commercial SmallSat Data Acquisition Program (NASA CSDA, award #80NSSC21K115) (see details in the ‘Research Portfolio’ page).
Journal article
Evaluating a Novel Approach to Detect the Vertical Structure of Insect Damage in Trees Using Multispectral and Three-Dimensional Data from Drone Imagery in the Northern Rocky Mountains, USA.
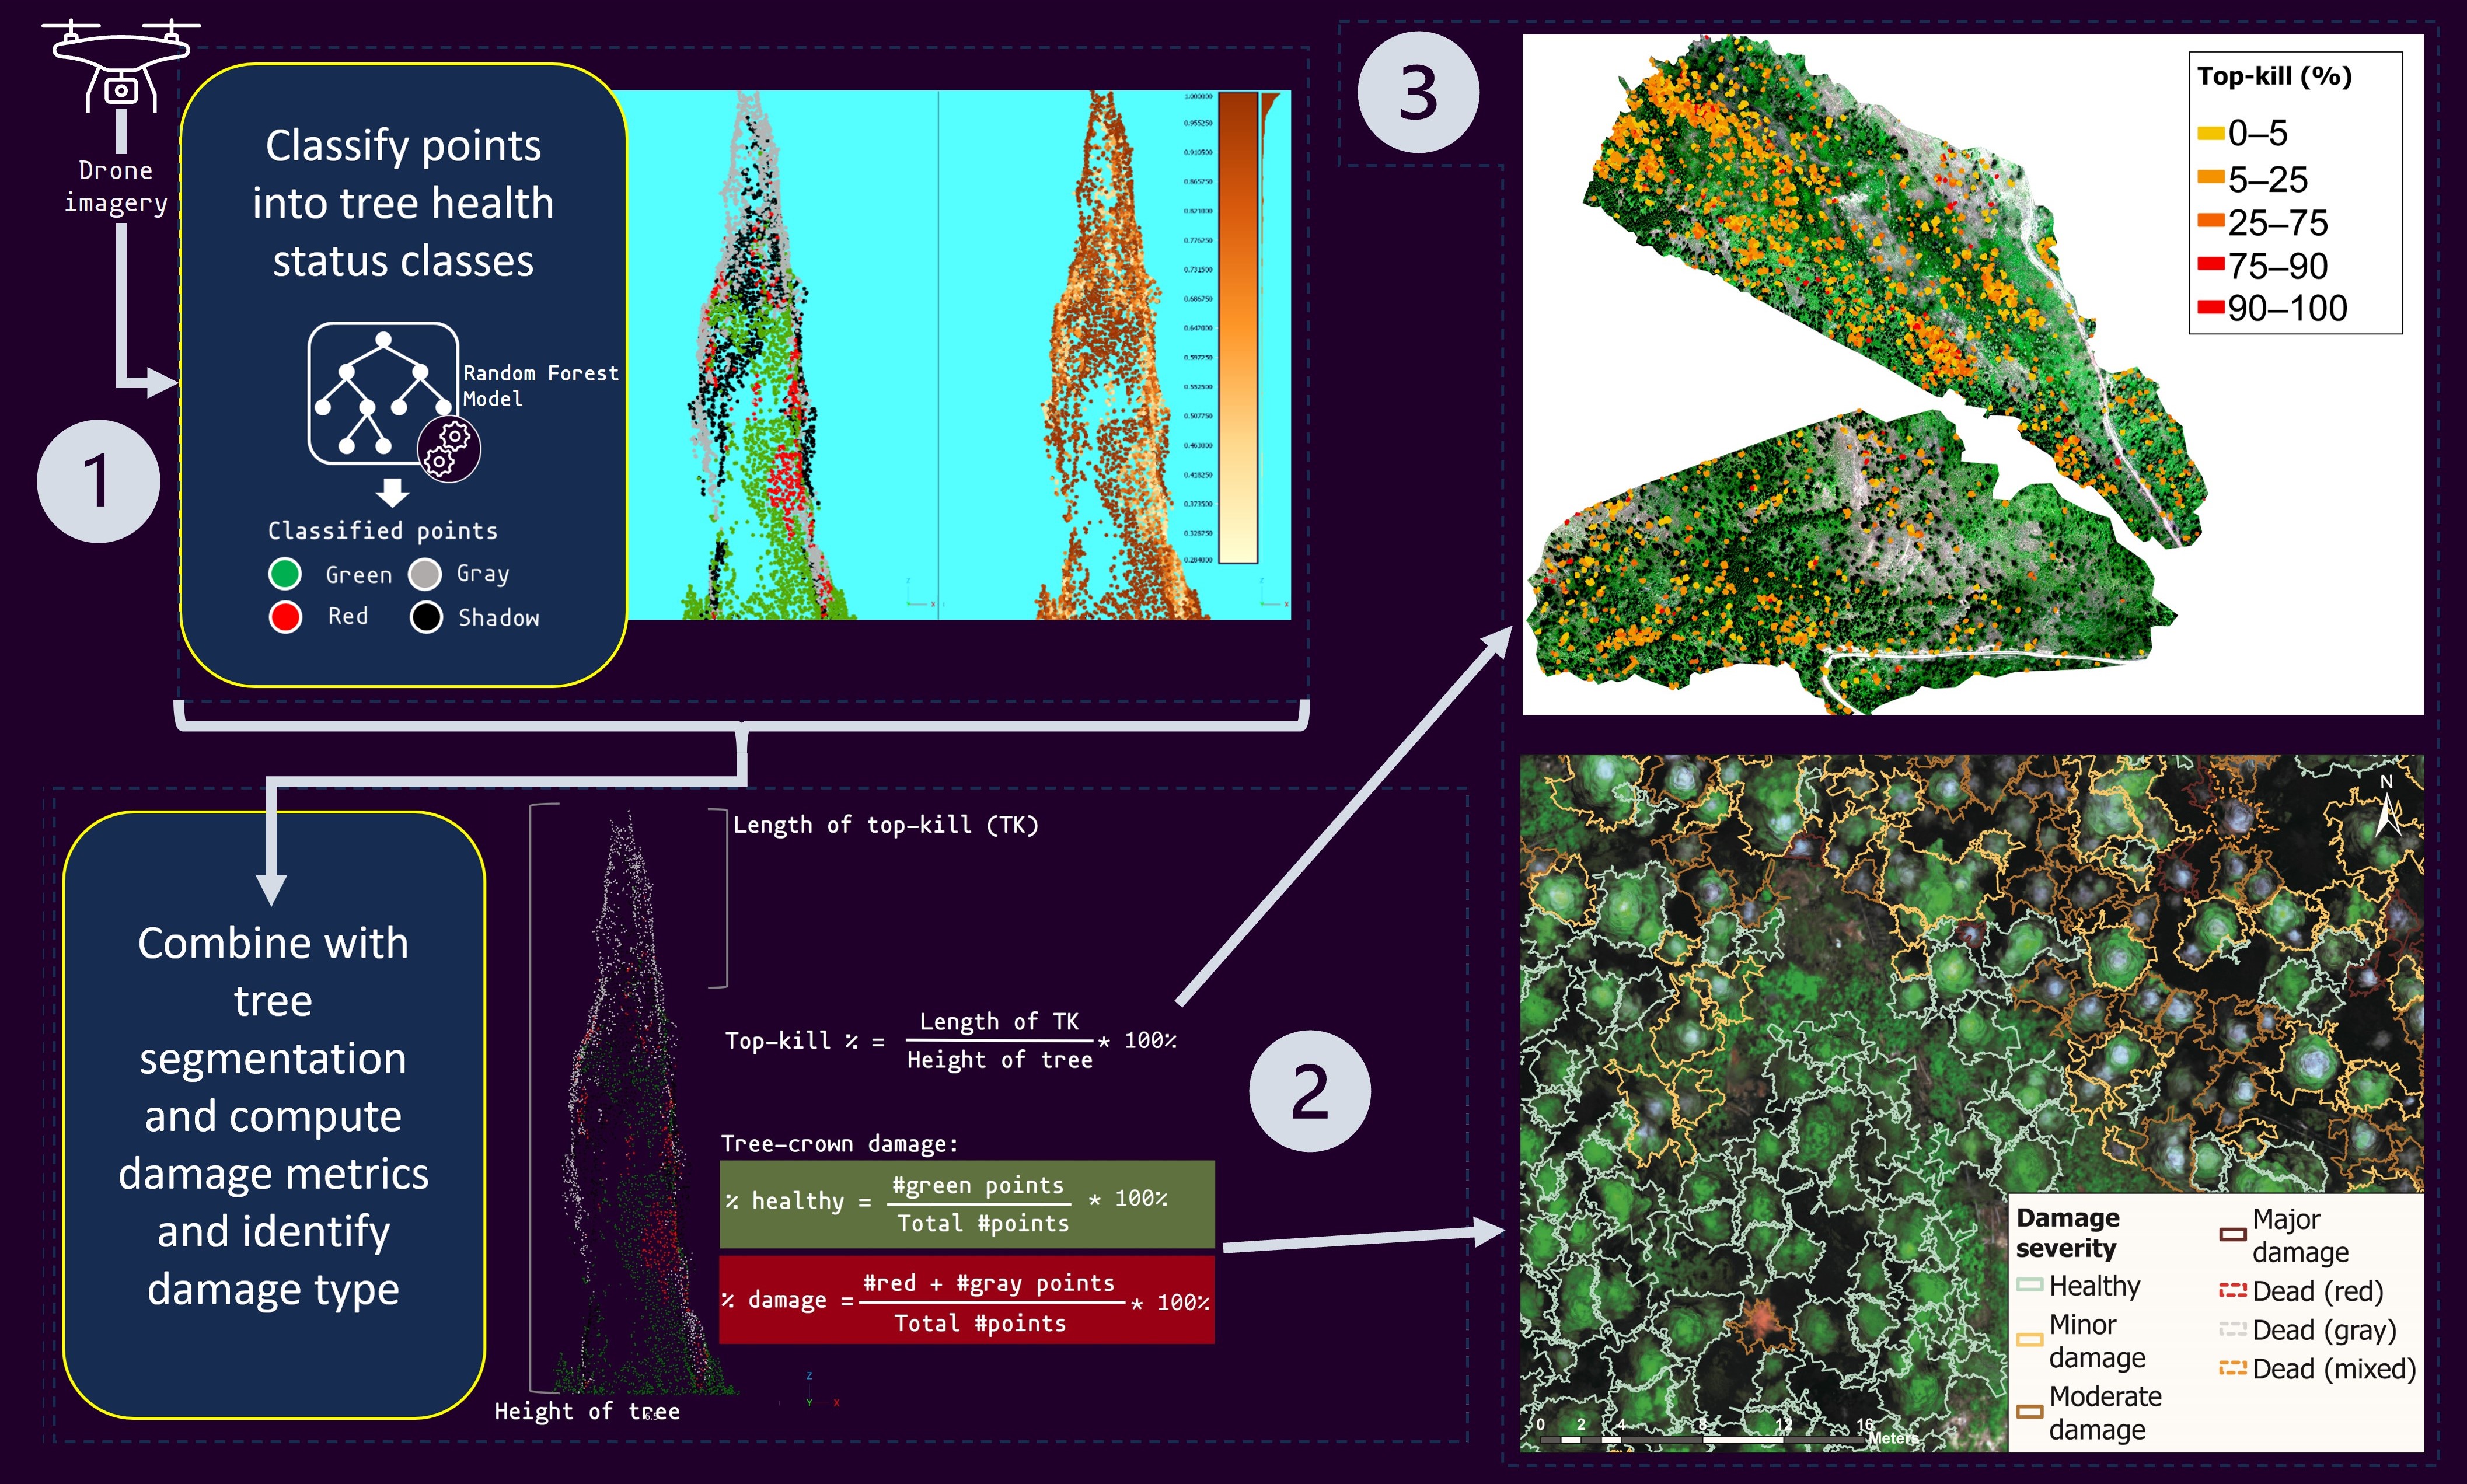
Graphical abstract
Potree Point Cloud Viewer
- The current scene is only rendering the RGB point cloud.
- Navigate to Scene > Objects > Point Clouds to toggle the visibility of the random forest (RF) classified point cloud and point cloud with classification probability.
- RF classes: green is healthy, red is red, gray is gray, and black is shadow.
- RF probability: warmer color (orange-red) higher classification probability, cooler color (yellow-blue) lower classification probability.
- Navigate to Scene > Objects > Other to toggle the visibility of the tree crown outlines from the point cloud segmentation of individual trees. The color of the tree crown outlines follow the following color scheme: Healthy (forest green), Minor damage (faded orange), Moderate damage (vibrant orange), Major damage (vibrant red), NA (black).
- Double-click on the annotations (e.g., "Top-killed tree") to zoom to the tree.
To open the Potree viewer in a new tab (full-screen), click here.
Top-kill detection and assessment algorithms
There are two top-kill algorithms implemented for this project: top2bin and bin2bin. Both algorithms begin at the top of the tree and progresses downward. Details for the each algorithm are as follows:
| top2bin | bin2bin |
|---|---|
The top2bin algorithm assesses the percentage of damage points within a set of height bins from the top of the tree to a given height. | The bin2bin algorithm assesses the percentage of damage points for each height bin beginning at the top of the tree and progressing downward. |
 |  |
Interactive preview of top-kill detection algorithm on the point cloud of a single tree
Use the left mouse button to tilt the 3D model and the mouse scroll wheel to zoom in and out.
True-color render, random forest classification of point cloud and top-kill algorithm
Left panel: True color representation of the point cloud. Right panel: RF classification; green is healthy, red is red, gray is gray, and black is shadow.Top-kill algorithm applied to point cloud, red plane represents the height of top-kill detected by the algorithm.
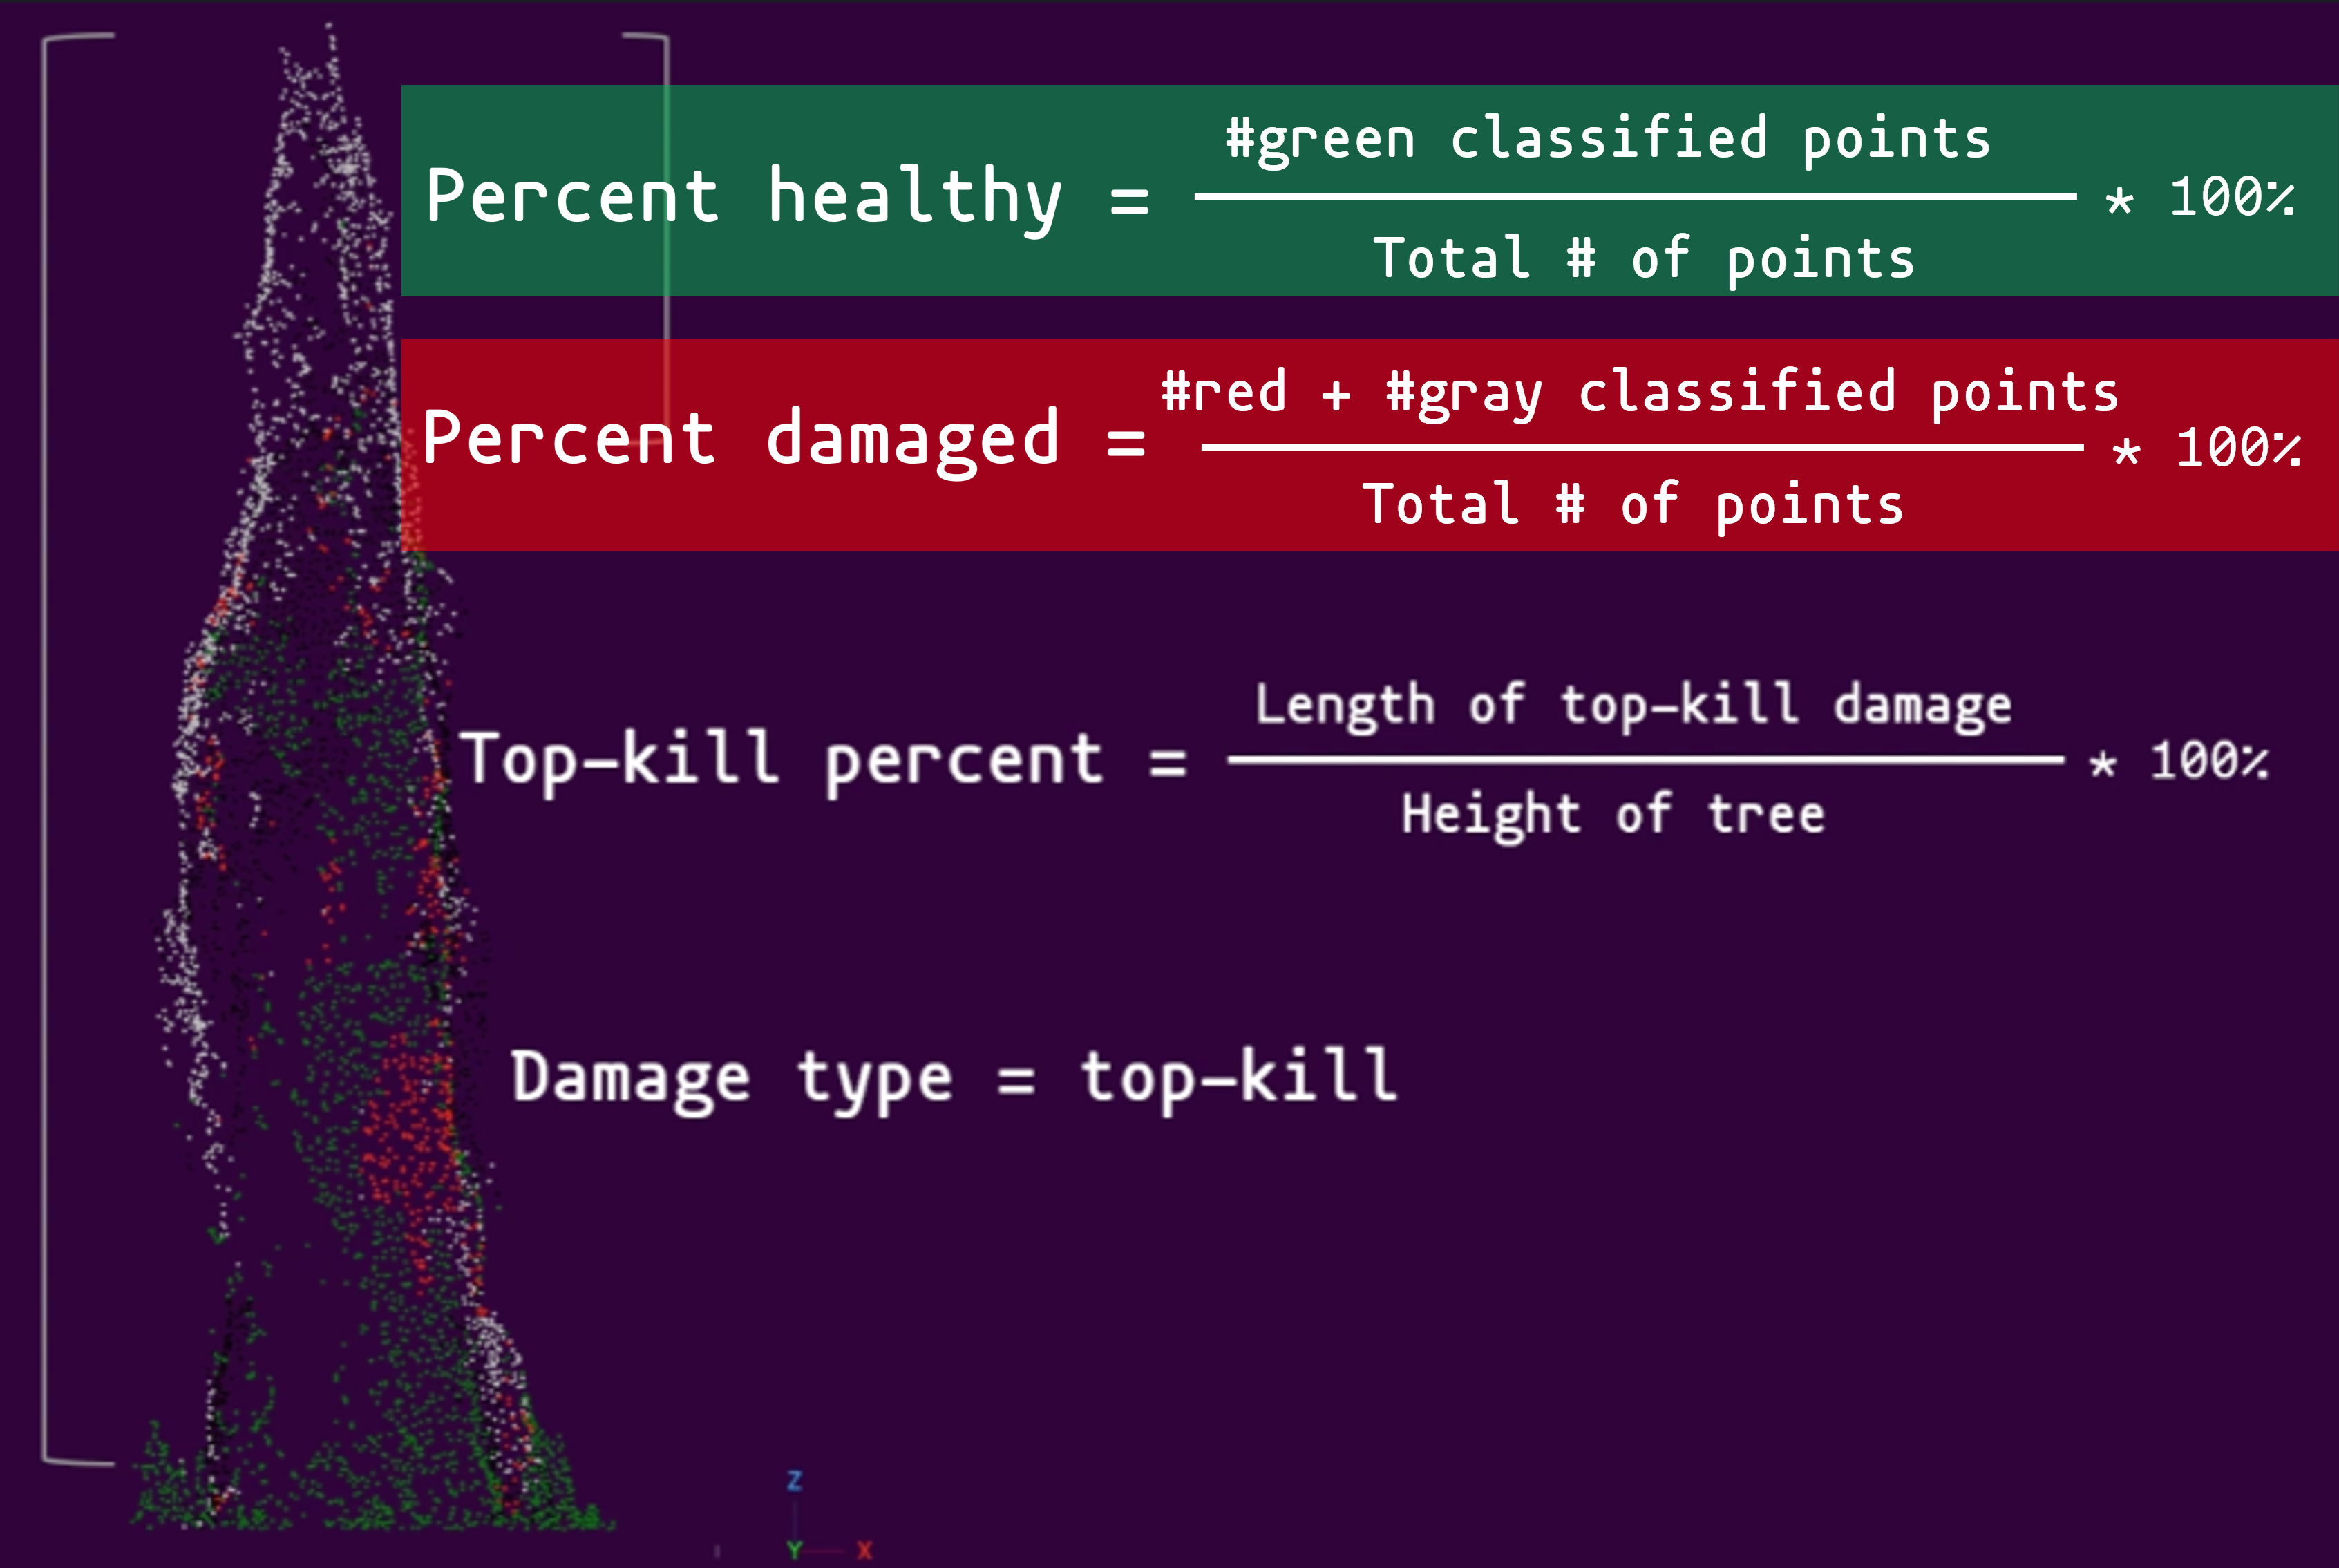
Summary of tree damage metrics:
Presentations
I presented a condensed version of my MS research for University of Idaho’s GIS day 2023 as a contributed talk.
To view the recording of the presentation, please follow this link:
To view the pdf of the presentation file, please follow this link: https://objects.lib.uidaho.edu/gisday/shrestha_gisday2023.pdf